
Tactics 101: 022 – Intelligence Preparation of the Battlefield in Urban Operations Part 2
WHAT NEXT?
When conducting IPB against a conventional force we would now take the enemies doctrine and tactics (which results in a doctrinal template) and covert them into situational templates (how the enemy wants to fight in this particular situations). These situational templates are then used to determine the enemy’s possible courses of action (Step 4 of the IPB process). When fighting against unconventional foes creating these doctrinal and situational templates is a more difficult proposition. This is because doctrinal templates may be hard to come by since an unconventional enemy’s doctrine and tactics may not be currently known. So how do determine a threat’s operating patterns so you can develop courses of action? Well, one technique is to collect historical data by using various tools that can depict past and current enemy operations. These can then be utilized to anticipate future enemy operations. Below we will show some of the tools you can employ to collect data and then use it to analyze your opponent. We will break them up into two different categories – pattern analysis and link analysis.
{default}PATTERN ANALYSIS
Pattern Analysis is used to depict the times and dates of selected activities (such as ambushes, bombings, and demonstrations) to search for patterns of activity for predictive purposes as well as to discern intent. This analysis will assist us (if used correctly) to develop feasible enemy courses of action in Step 4 of the IPB process.
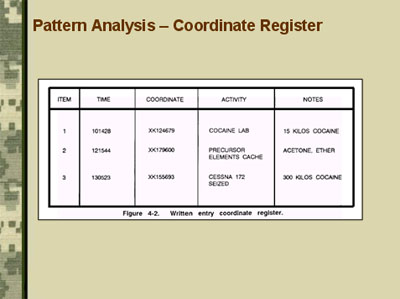
Above is a simple written entry coordinate register. It is used to just compile data that has occurred for future analysis. For example, item 1 states that on the 10th of the month at 1428 (2:28PM) at grid xx124679, a cocaine lab was uncovered with 15 kilos of cocaine seized. This incident tells us that there is a criminal element within the enemy. Our analysis could tell us that money from these operations is used to support enemy operations.
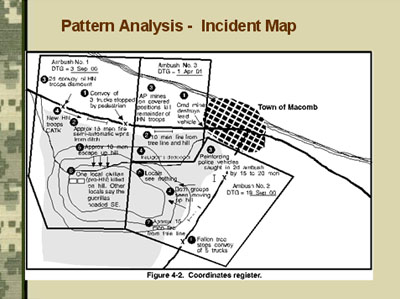
Another way to graphically depict data is to develop an incident map. The true value in this tool is enables us to view incidents spatially. This can allow us to see enemy patterns as to locations where they occurred.
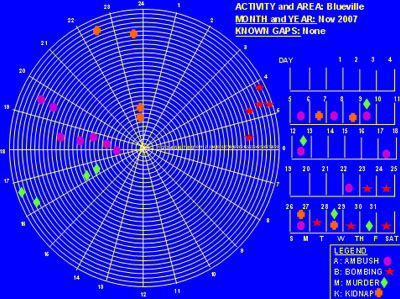
PATTERN ANALYSIS PLOT SHEET
The pattern analysis plot chart shown above is used to depict the time and date trends of types of activities. The “wagon wheel†represents one month: each concentric circle is a day that is divided into 24 one-hour segments. Events are logged on the wheel as they occur. For instance, in the example all bombings take place between four and six in the morning, and all fall on days near the end of the month. Understanding these traits provides the basis for developing hypotheses on the enemy’s intentions. The timings indicate that the bombers may not seek to kill people; most people are in bed at the hours of detonation. The end of the month could possibly indicate that they are seeking to influence the views of the less wealthy, those whose disgruntlement at having little cash at month’s end would make them more likely to support actions that attack establishment targets. Various other hypotheses are feasible. It is up to you to further focus your collection assets in order to test hypotheses derived using this tool.
[continued on next page]
0 Comments
Trackbacks/Pingbacks